A Comprehensive Introduction to Hyperspectral Data: Unveiling the Unseen (Part I)
on Fri Oct 20 2023
Migel Tissera
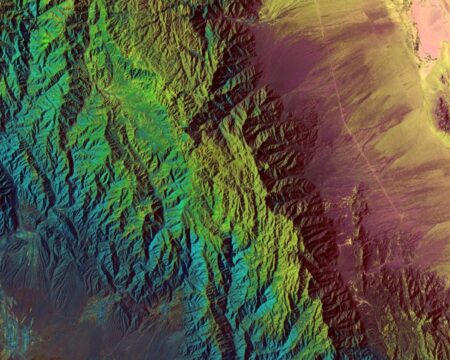
As we continue to push the boundaries of technology and innovation, we often find ourselves exploring realms beyond the visible, diving deep into the world of the unseen. Today, we embark on a captivating journey to understand a fascinating subject that is transforming our perception of the world: Hyperspectral Data. This post marks the beginning of a comprehensive 5-part series where we will dissect, understand, and appreciate the intricacies of this remarkable technology.
Hyperspectral Data: A Primer
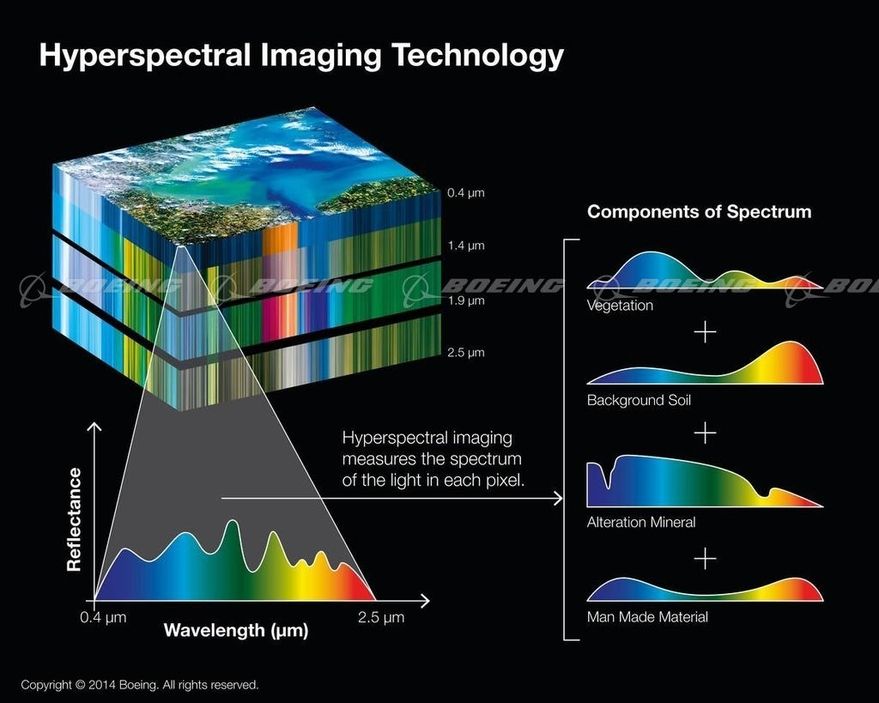
At its core, hyperspectral data is about capturing and analyzing information across the electromagnetic spectrum. The electromagnetic spectrum is a vast field, extending from radio waves to gamma rays, and hyperspectral data allows us to capture a wealth of information that lies within this spectrum.
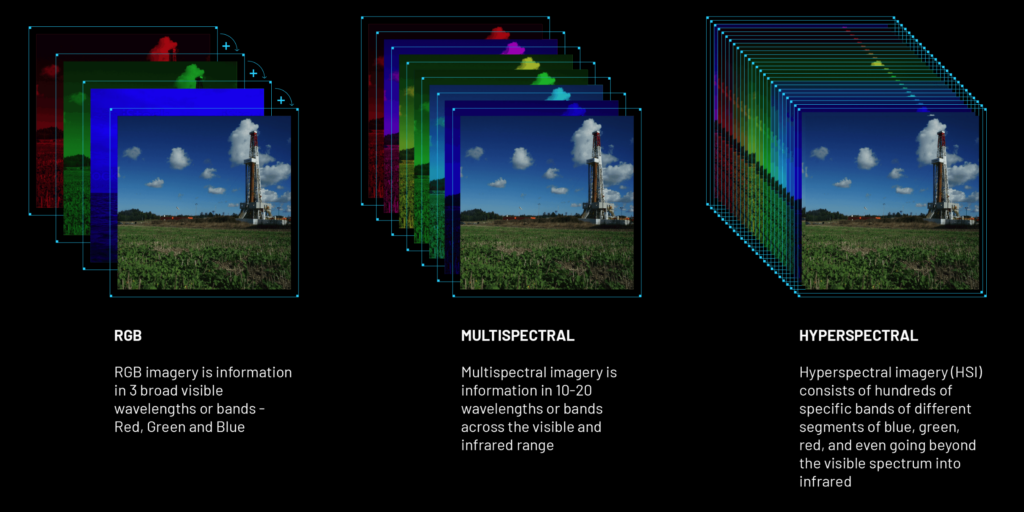
Unlike the human eye, which perceives only three primary colors – red, green, and blue, hyperspectral sensors can detect hundreds of individual wavelengths. This creates a continuous and detailed spectrum for each pixel in an image, offering a depth of information that goes far beyond what the human eye can perceive.
Hyperspectral versus Multispectral: Understanding the Difference
To fully appreciate the power of hyperspectral data, it is essential to understand its distinction from multispectral data. Multispectral data is often used in satellite imaging, like in the Landsat series. While multispectral data captures data in specific, separate bands (like RGB or infrared), hyperspectral data captures data in many closely-spaced, continuous bands.
Think of multispectral data as listening to a few notes on a piano, whereas hyperspectral data lets you hear the entire scale in exquisite detail. This analogy illustrates the difference in the level of detail and granularity between the two types of data. The richness of hyperspectral data provides a more comprehensive understanding of the subject, making it an invaluable tool in various fields.
Visualizing Hyperspectral Data: Exploring the Unseen
The visualization of hyperspectral data is akin to exploring the unseen. Traditional images give us a visual representation, a snapshot of what our eyes can perceive. In contrast, hyperspectral imaging reveals variations in materials, subtle changes in health (for plants or tissues), or even hidden patterns not visible to the naked eye.
To illustrate, a regular photograph of a forest may just show us green trees. However, hyperspectral imaging could distinguish between species, or even identify stressed trees that might be affected by disease or drought. This highlights the potential of hyperspectral data in providing insights beyond surface appearances, enabling us to detect and respond to issues that may not be apparent to the human eye.
In the upcoming posts, we will delve deeper into the methods of capturing this data, its myriad of applications, and the potential it holds for future innovations. We will also introduce some of the existing statistical algorithms heavily used in this field, as well as novel Deep Learning-based methods that are pushing the boundaries of what’s possible with hyperspectral data.
We invite you to stay tuned and join us on this exciting journey. If you have any questions or areas you’re particularly curious about, we encourage you to reach out.
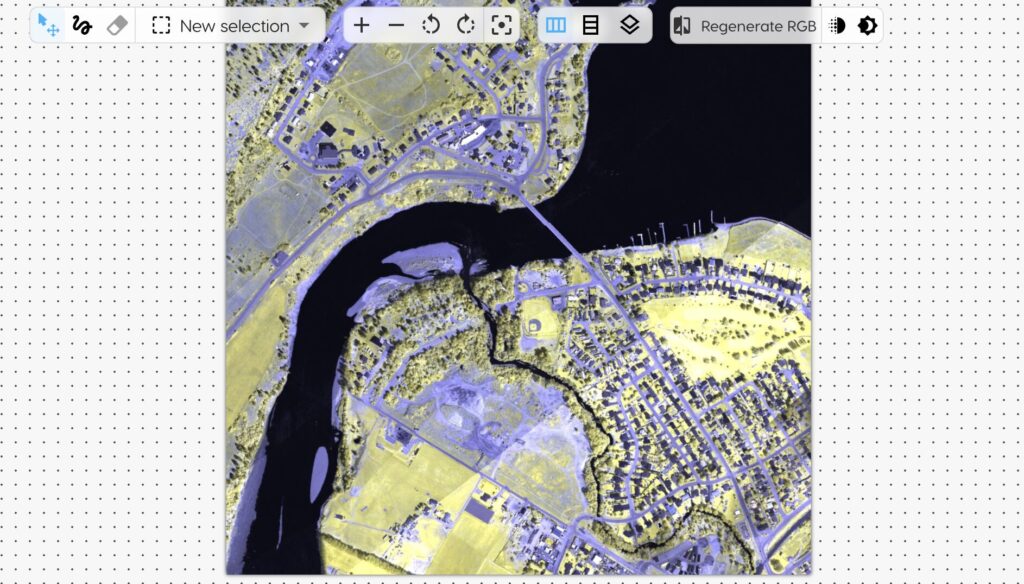
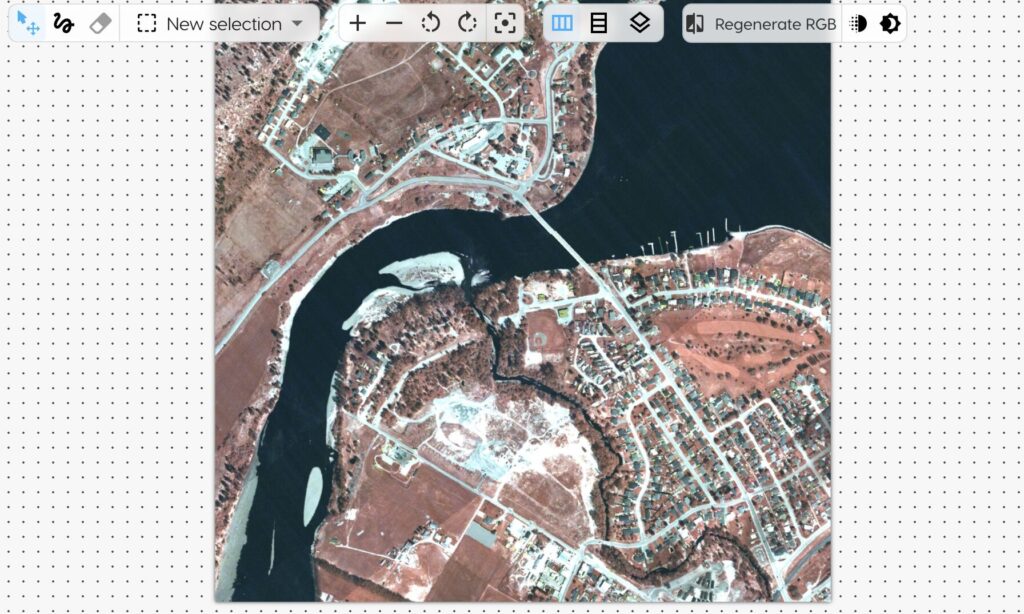
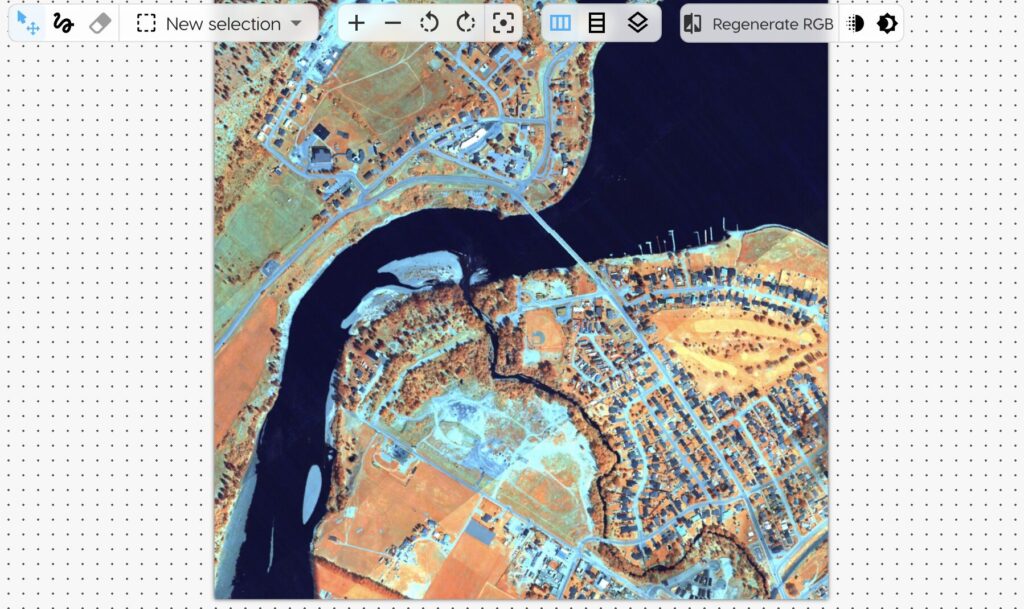
To give you a glimpse of what’s to come, below is a hyperspectral image of a town in British Columbia, Canada. The image, captured and provided by Itres Research Limited, showcases some spectral signatures and its Principal Component Analysis (PCA) plot, offering a taste of the level of detail and insight hyperspectral data can provide.
This series promises to be an enlightening exploration of hyperspectral data, a technology that’s reshaping our understanding of the world. As we delve deeper into this subject, we look forward to unveiling the unseen and exploring the myriad ways hyperspectral data can be harnessed for the betterment of our world.
If you would like to explore hyperspectral imagery yourself and see the power of the vast information captured, please visit our sandbox (no sign-up necessary!) at: https://fusion.metaspectral.com/sandbox
