Lithium Detection over the McDermitt Deposit Using Metaspectral’s Clarity Platform
Lithium detection pipeline at the McDermitt deposit using EnMAP hyperspectral data and Metaspectral’s Clarity analysis platform.

Guillaume Hans
Senior Research Scientist
The global race for critical minerals is putting pressure on traditional exploration methods. The hunt for “white gold”, lithium, is shifting from traditional soil sampling toward advanced hyperspectral imaging to identify resources that are too remote or complex. Accelerating this discovery is vital for the green energy transition, but it requires tools that can process massive satellite datasets with geological precision.
A landmark study by Asadzadeh & Chabrillat (2025) demonstrates this potential in the McDermitt Caldera, the largest known lithium deposit in the United States, located in south-east Oregon at the Nevada border. Their research utilizes EnMAP satellite data and a methodology called “Mixture-Tuned Feature Matching” (MTFM) to accurately detect lithium-bearing minerals. MTFM works by isolating diagnostic absorption features through continuum removal, generating synthetic library mixtures at discrete increments, and performing least-square fitting to find the best spectral match for every image pixel.
Metaspectral’s Clarity Platform is designed to bring this level of academic rigor to the industrial scale. As a high-performance, cloud-native hyperspectral analysis platform, Clarity allows exploration teams to replicate this type of workflow while comparing it against Clarity’s internal deep learning tools. In this post, we walk through the replication of the MTFM lithium detection pipeline, from initial unmixing to sub-nanometer polynomial fitting, and show how AI-driven target detection can be used to rapidly identify high-potential zones before performing detailed spectral analysis.
Leveraging EnMAP Imagery
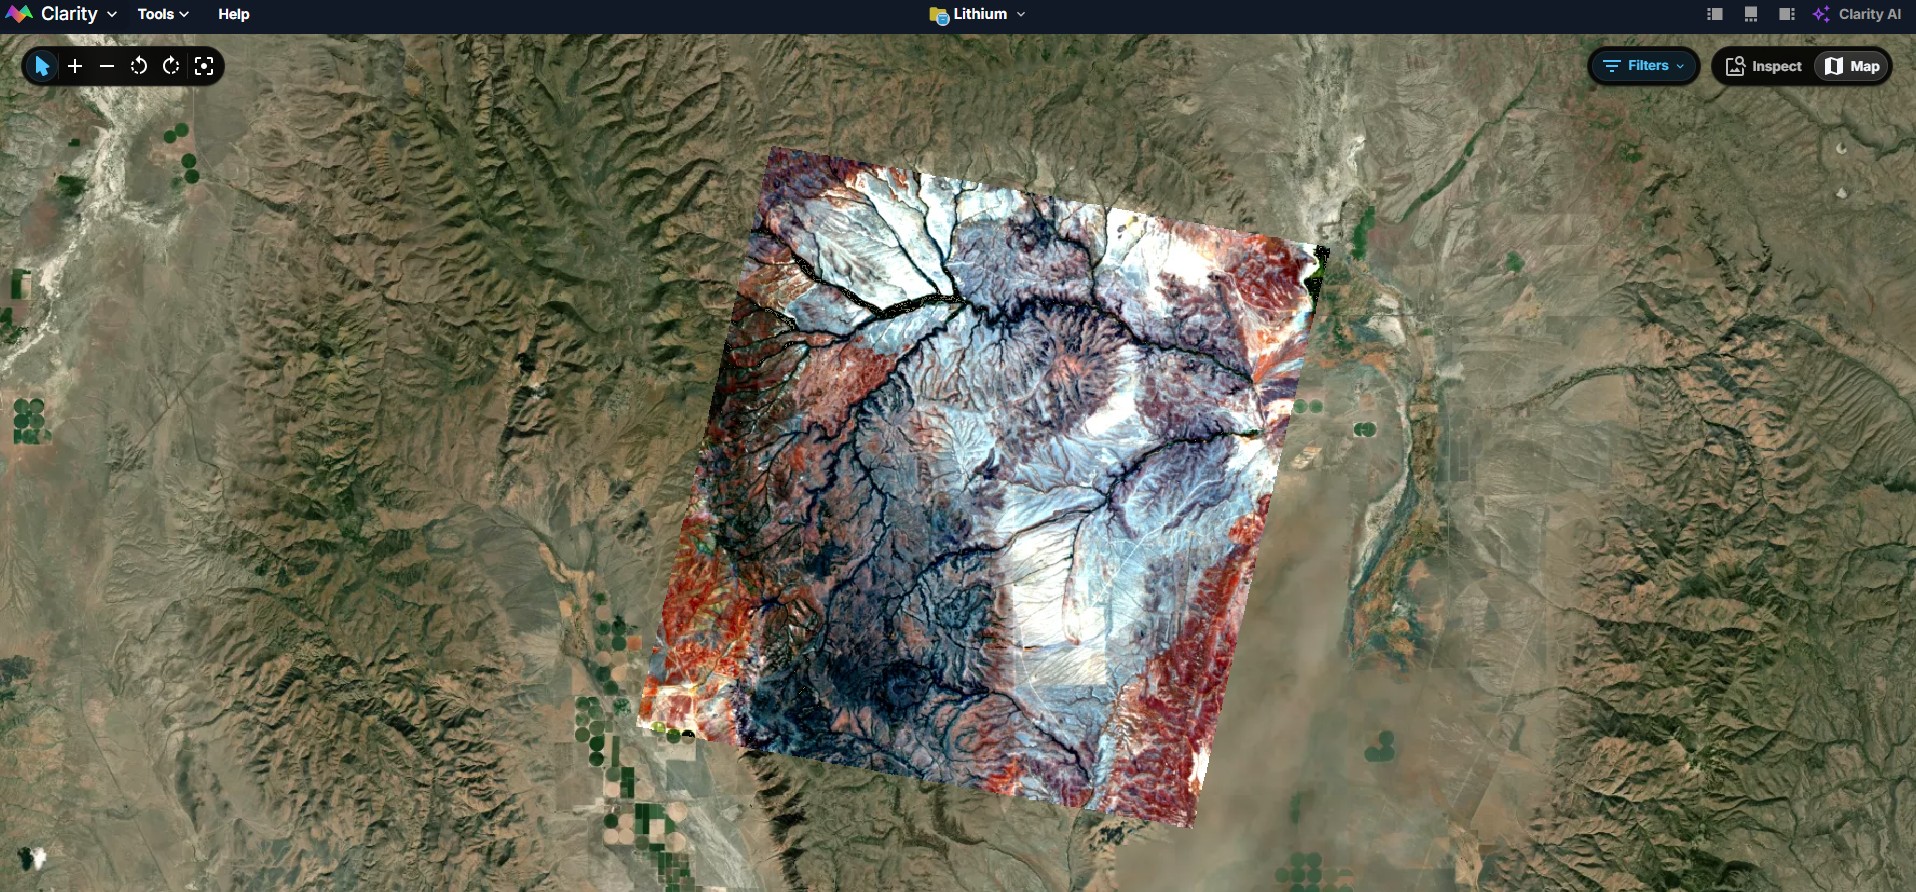
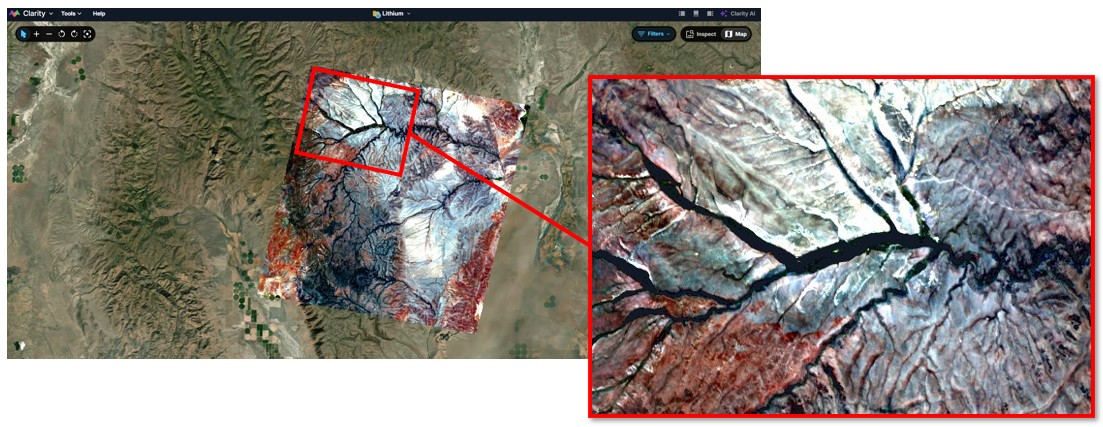
For this study, like Asadzadeh & Chabrillat (2025), we utilize data from the Environmental Mapping and Analysis Program (EnMAP). EnMAP provides high-quality hyperspectral data with 242 bands across the visible and near-infrared (VNIR) and short-wave infrared (SWIR) regions (420 nm to 2450 nm). Its spectral sampling of approximately 6.5 nm in the VNIR and 10 nm in the SWIR makes it uniquely suited for mineral exploration. Clarity is designed to directly ingest EnMAP’s products, allowing us to focus directly on our task: lithium detection. Figure 1 shows the EnMAP image acquired over the McDermitt deposit.
Lithium detection workflow in Clarity
Lithium in the McDermitt deposit is primarily hosted in Hectorite, a lithium-rich smectite clay. The key to identifying it remotely lies in the SWIR spectrum, specifically the 2200–2400 nm region. This range contains diagnostic absorption features for lithium-bearing clays, which shift slightly depending on the substitution of Lithium (Li) for Magnesium (Mg) in the mineral lattice.
To translate these geological markers into a digital map, we leverage the following workflow within the Clarity environment.
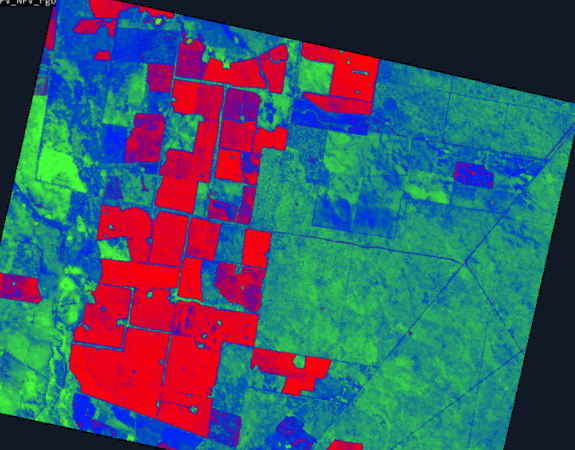
Vegetation masking
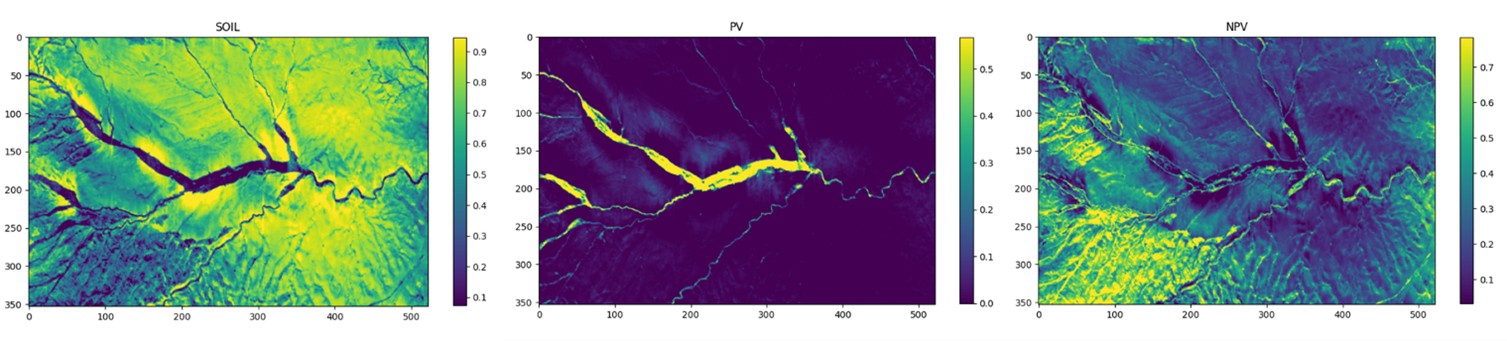
Before looking for minerals, we must remove “noise” from the landscape. In areas with sparse or dense vegetation, Photosynthetic Vegetation (PV) and Non-Photosynthetic Vegetation (NPV) can obscure mineral signatures. Using Clarity’s Linear Spectral Unmixing tool, we decompose each pixel into Soil, PV, and NPV components. This results in abundance maps shown in Figure 2, corresponding to each of these endmembers. All pixels from the ENMAP image for which the Soil fraction was smaller than 0.5 (50%) were masked.
Continuum Removal for Feature Enhancement
To compare mineral signatures accurately, we must isolate the absorption pits from the overall “slope” of the reflectance curve. This is achieved through Continuum Removal (CR).
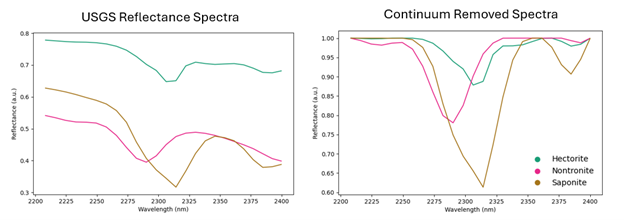
In raw spectra, the true shape of an absorption feature is often distorted by the background reflectance (“continuum”) caused by factors like grain size, surface moisture, or other non-target minerals. This background creates an overall slope that can shift the apparent position of an absorption minimum or make a deep feature appear shallow. By removing this continuum, we effectively “zoom in” on the chemical bonds of the mineral itself, effectively normalizing the data so that the depth and shape of the Hectorite absorption feature become the primary variables (as illustrated in Figure 3).
In Clarity, CR is achieved using a fast convex hull computation algorithm. This process “flattens” the spectrum between 2200 and 2400 nm, allowing for precise comparison between image pixels and library standards.
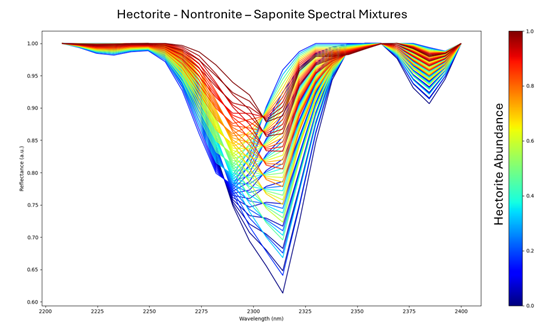
Library Spectra and Synthetic Mixtures
The ENMAP image spectra are compared against gold-standard spectra from the USGS library. Following Asadzadeh & Chabrillat (2025), spectra from three minerals were selected: Hectorite, Nontronite, and Saponite. Indeed, while Hectorite is the primary lithium-bearing mineral at McDermitt, it rarely occurs in isolation. It is typically found within a complex assemblage of smectite clays, including Nontronite (Fe-rich) and Saponite (Mg-rich). Identifying the specific “sweet spot” of lithium mineralization requires distinguishing Hectorite from these spectrally similar neighbors (Figure 3). To account for this, Clarity generates linear mixtures of these three primary minerals based on their spectra, automatically resamples them to match the specific wavelength intervals of ENMAP and applies the same CR pre-processing. This provides a comprehensive reference set for the complex mineralogies found at the McDermitt site (Figure 4).
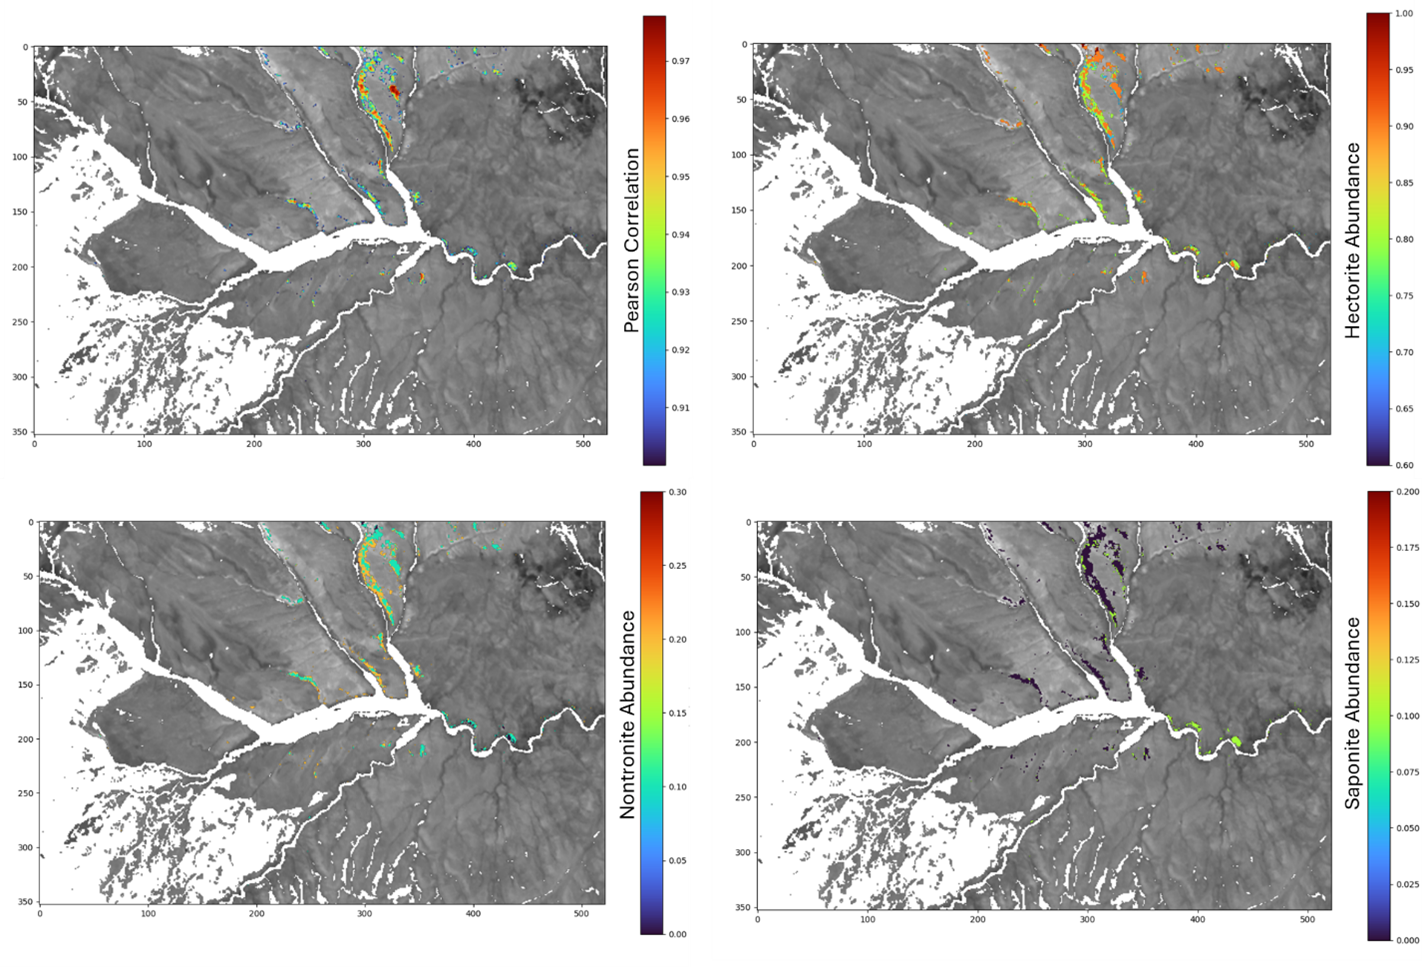
Mixture Tuned Feature Matching (MTFM)
This is the “engine room” of this lithium detection approach. MTFM performs a Least Square Fitting to match each image pixel against every synthetic mixture presented above (Figure 4) and computes the Pearson Correlation. The specific mixture that yielded the highest match is retained along with the correlation value. To maximize the signal-to-noise ratio and ensure high-confidence detections, we retain only pixels with a correlation higher than 90%. This procedure provides a robust estimate of mineral presence. The correlation value serves as a proxy for mineral abundance, allowing us to generate a heatmap ranging from low to high lithium potential. These heatmaps are presented in Figure 5 where pixels with a correlation lower than 90% were masked for visual interpretability purposes.
Streamlining the Workflow with Deep Learning
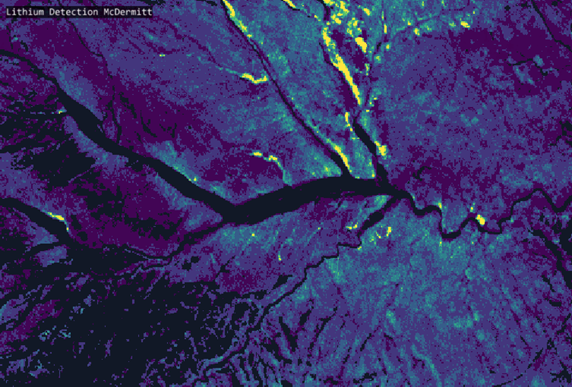
While the MTFM approach is highly effective, the preprocessing required, the manual creation of synthetic mixtures and iterative least-square fitting can be computationally intensive and time-consuming. To accelerate discovery, Clarity offers a Deep Learning Target Detection model.
By using the USGS Hectorite spectrum directly as a target, the deep learning model can generate an abundance map (Figure 6) that rivals the accuracy of the MTFM approach while bypassing the preprocessing, mixture creation, and fitting stages entirely. This reduces the time and effort required, thereby offering potential for rapid field deployment and decision-making.
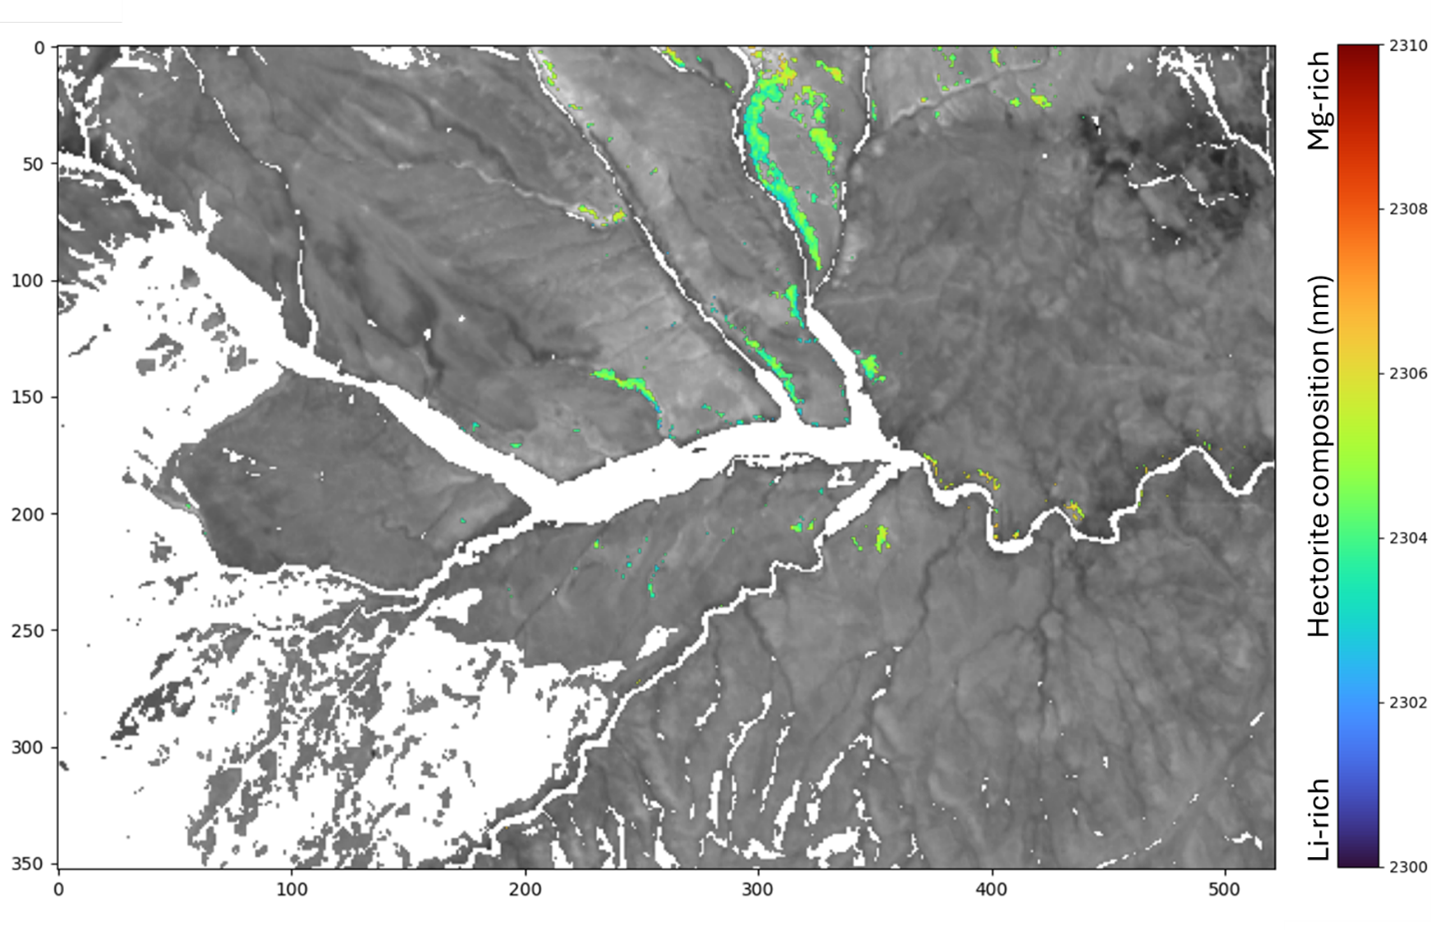
Hectorite Lithium Richness
The final and most precise step involves finding the analytic minimum of the hectorite absorption pit. This analysis can be applied directly to the high-confidence pixels identified via the MTFM workflow or the Deep Learning model. Because lithium content causes a subtle shift in the position of the absorption pit, a 4th-order polynomial is fitted to the pixels with the highest hectorite abundance. Despite EnMAP’s 10 nm spectral sampling, polynomial fitting allows Clarity to estimate the exact wavelength of the minimum at a sub-nanometer scale. By mapping these precise wavelength positions across the deposit (Figure 7), Clarity effectively grades the lithium concentration of the Hectorite clays from space or aircraft. Higher Lithium content is translated by a shift of the absorption pit towards lower wavelengths.
Conclusion
Metaspectral’s Clarity platform moves your hyperspectral data from reflectance to actionable mineralogical maps. Clarity provides the flexibility to compare and combine industry-standard methodologies with modern AI-driven tools to replicate and scale state-of-the-art research. This dual-pathway approach ensures both operational efficiency and geological accuracy, securing the future of the global critical minerals and green energy sectors.
Are you exploring Lithium or other critical minerals?
Contact Metaspectral to see how Clarity can accelerate your discovery timelines.
References
Asadzadeh, S. & Chabrillat, S. (2025). Leveraging EnMAP hyperspectral data for mineral exploration: Examples from different deposit types. Ore Geology Reviews, 186, 106912. https://doi.org/10.1016/j.oregeorev.2025.106912
Talk to Metaspectral about your use case.
Bring us your material stream, imagery, or operational question and we will help scope the next evaluation.
Related Resources
More product thinking and reference material from the Metaspectral team.
Seeing beyond the bands
Where hyperspectral analysis diverges from multispectral — and what that divergence reveals about a crop. Measured on real scenes.
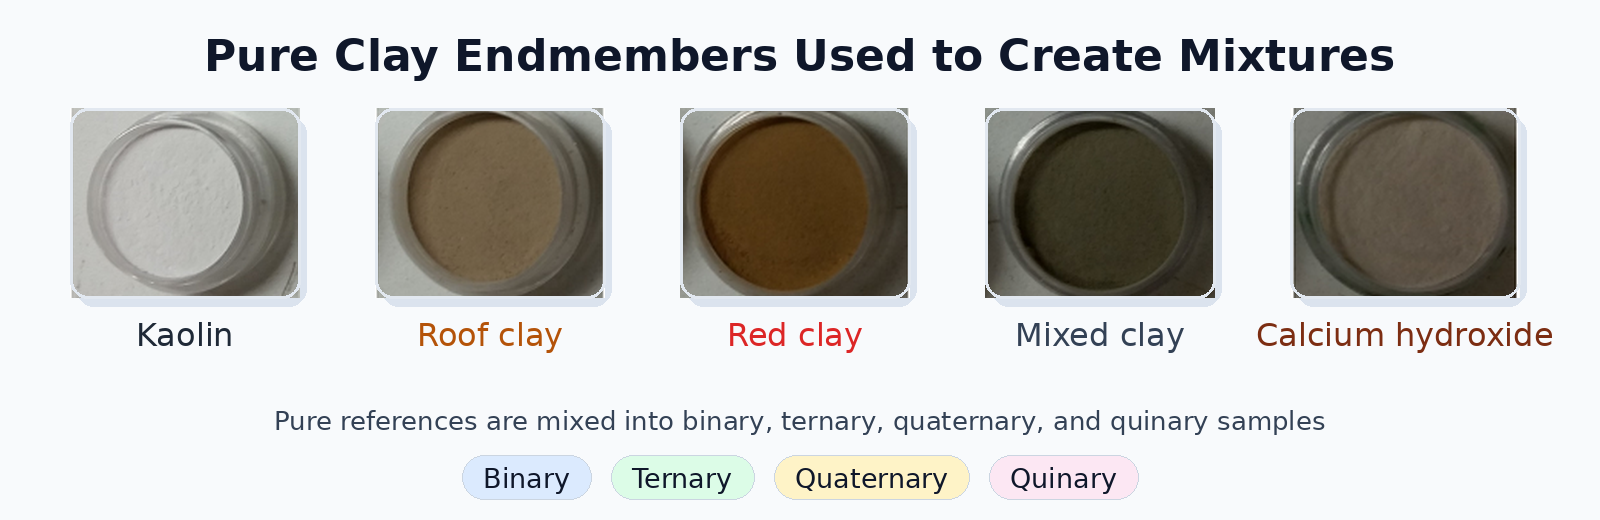
Evaluating Deep Learning Spectral Unmixing From Pure Reference Spectra
A deep learning model trained only on synthetic mixtures — generated from pure reference spectra — outperforms classical solvers on four- and five-material mixtures across nine sensors. The benchmark: 325 real clay powder mixtures measured by lab spectrometers, pushbroom cameras, snapshot cameras, MWIR, and RGB.
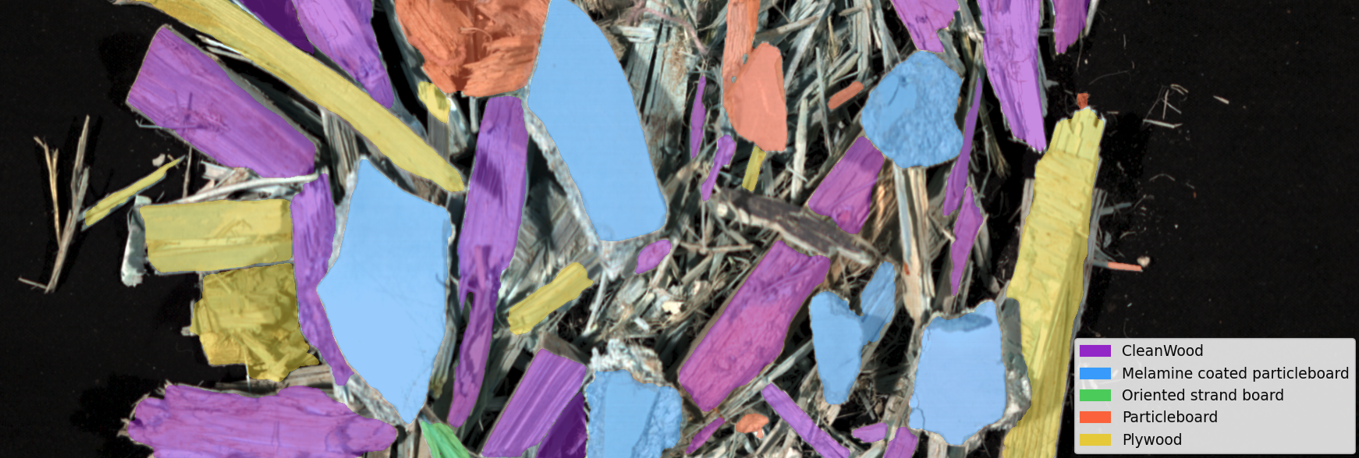
Automated Classification of Waste Wood Composites: An Evaluation of Hyperspectral Imaging and Deep Learning Pipelines
New collaborative research between UBC and Metaspectral evaluates near-infrared hyperspectral imaging and deep learning pipelines for automated classification of post-consumer waste wood composites, achieving up to 100% accuracy under controlled conditions and 91.2% on real landfill material.